
We analyzed 830 size-chart entries from 26 Italian footwear brands to find out how consistent Italian to US shoe size conversions really are.
Specifically, we looked at how often brands agree on the US equivalent of an Italian or European shoe size, how much their published foot-length measurements differ, and whether sizing can change between different footwear categories from the same brand.
We also looked at the information brands give shoppers in the first place, including US sizes, centimeters, inches, and proprietary brand sizing.
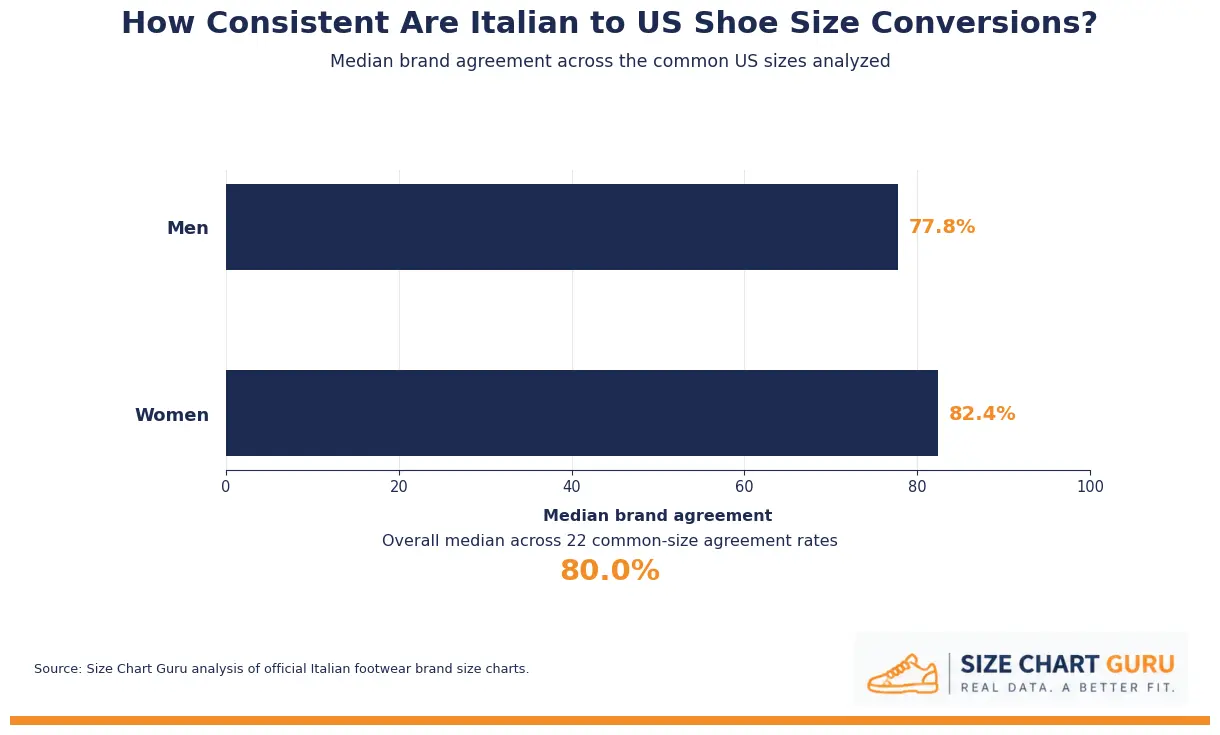
The results show that there is a recognizable conversion pattern. Across the 22 common men’s and women’s US sizes we analyzed, the median agreement on the most common Italian/European equivalent was 80.0%.
But that doesn’t mean the charts are interchangeable.
In some cases, brands that use exactly the same US and Italian/European size labels still publish foot-length measurements that differ by more than 2 cm.
We also found differences within individual brands, where the conversion or recommended foot measurement changed depending on the type of shoe.
Here’s what we found…
If you’re looking for the actual size conversions rather than the study behind them, see our Italian to US shoe size conversion chart.
Here Is a Summary of Our Key Findings:
1. Across the 22 common men’s and women’s US sizes we analyzed, median brand agreement on the most common Italian/European equivalent was 80.0%. There is a recognizable conversion pattern across brands, but it isn’t universal.
2. Women’s conversions were somewhat more consistent than men’s. Median agreement was 82.4% for women’s sizes, compared with 77.8% for men’s sizes.
3. Men’s agreement changed considerably depending on the size. Across the common men’s sizes we analyzed, agreement ranged from 63.2% to 93.8%, a difference of more than 30 percentage points.
4. Published foot-length measurements varied more than the size labels alone suggest. The largest observed spread across the common sizes was 1.7 cm for men and 2.6 cm for women.
5. Large differences remained even when brands agreed on both size labels. Among brands using the same US and Italian/European size combination, published foot-length measurements still differed by as much as 1.7 cm for men and 2.2 cm for women.
6. Sizing can also change within the same brand. Premiata’s men’s Heritage and Sneaker charts don’t always assign the same US size to the same EU size. At EU 47, the difference reached 1.5 US sizes, with Heritage listing US 14 and Sneakers US 12.5.
7. Centimeter measurements weren’t available from every brand. 20 of the 26 brands, or 76.9%, provided centimeter measurements in their official sizing information.
8. General conversion charts have a real basis in the brand data, but they shouldn’t be treated as universal. The 80.0% median agreement shows a clear central pattern, while the differences between brands, published foot-length measurements, and product categories show why the individual brand’s chart should take priority when available.
We break down these findings, the individual size results, and our methodology below.
How We Conducted This Study
For this study, we collected 830 individual size-chart entries from 26 Italian footwear brands.
We worked from the sizing information published by the brands themselves rather than starting with a standard conversion formula and checking whether each brand matched it.
The dataset includes men’s and women’s footwear across luxury fashion, traditional shoemaking, sneakers, and casual footwear.
When a brand published separate charts for different footwear categories, we kept those charts separate rather than combining them.
We Counted Brands, Not Charts
Some brands gave us more sizing data than others.
For example, Dolce & Gabbana has separate men’s charts for Formal shoes and Sneakers. Premiata also has different charts for Heritage shoes and Sneakers.
If we simply counted every chart as an independent observation, brands with multiple charts would have more influence on the results.
So our main agreement percentages are calculated at the brand level.
For example, at US men’s 8, 15 of the 19 eligible brands used size 41.
That gives us an agreement rate of:
15 ÷ 19 × 100 = 78.9%
A brand with several charts doesn’t automatically get several votes in that calculation.
We Kept the Original Size Labels
Not every Italian brand describes its sizing system the same way.
Depending on the brand, we found labels including IT, EU, Europe, IT/EU, and brand-specific sizing systems.
We preserved those original labels in our raw data.
Proprietary brand-size fields were not treated as Italian or European sizes unless the source explicitly identified them that way.
For the cross-brand analysis, we compared the numerical continental sizes only when the source gave us enough information to make that comparison confidently. We didn’t automatically relabel every EU or Europe column as “IT.”
This is why you’ll often see us use Italian/European or continental size when discussing the results across multiple brands.
We Didn’t Fill In Missing Sizes
If a brand didn’t publish a particular size, we left it missing.
We didn’t interpolate half sizes or use a conversion formula to create values that weren’t present in the original chart.
The same applies to ranges.
If a brand listed a conversion such as EU 40.5–41, we preserved that range rather than turning it into a single exact size for a calculation that required an exact conversion.
Ambiguous Data Wasn’t Forced Into the Analysis
We also excluded individual data from a calculation when the source labeling wasn’t clear enough for that particular comparison.
This matters because a number appearing in a sizing chart doesn’t automatically tell us exactly what sizing system it represents.
For example, a combined UK/US column can’t be treated as an unambiguous US conversion. Likewise, an unusually labeled US column shouldn’t be included simply because the heading contains “US” if the underlying values make its meaning uncertain.
We preferred a smaller eligible sample over making assumptions about ambiguous data.
We Treated Foot Length Separately From Shoe Size
A conversion such as:
US 9 = size 39
and a measurement such as:
US 9 = size 39 = 25.5 cm
aren’t the same type of information.
We therefore analyzed the published foot-length measurements separately from the nominal size conversions.
This distinction became particularly important when we compared brands that agreed on both size labels but still published different centimeter values.
We also didn’t assume that the published centimeter measurement represents the internal length of the shoe. Throughout this study, foot length refers to the measurement given by the brand’s sizing information.
We Preserved the Measurements Brands Published
When a chart provided centimeters, we recorded the centimeter values.
When it provided inches, we recorded the inch values.
We didn’t mathematically adjust a manufacturer’s published measurement simply because its centimeter and inch values didn’t convert perfectly.
We also didn’t automatically interpret columns such as JP, KR, or China as centimeters unless the source explicitly identified them as a foot-length measurement.
The goal was to analyze what the brands actually published, not reconstruct what we thought their charts should say.
The Number of Eligible Brands Changes by Calculation
The study includes 26 brands, but that doesn’t mean every statistic has a denominator of 26.
A brand may not publish a particular US size. Another may provide the US conversion but no centimeter measurement. Another may use a range where the calculation requires an exact continental size.
So every statistic uses its own eligible sample.
That’s why you’ll see results such as:
15 of 16 brands
12 of 19 brands
or
10 brands with usable centimeter data
throughout the study.
We show those denominators alongside the percentages wherever they are important so readers can see exactly how much data each result is based on.
We Only Measured Information Availability When We Collected It Consistently
We also looked at what information brands provide shoppers, but only for fields we captured consistently across the dataset.
For example, we recorded centimeters and inches whenever they were provided, which allows us to compare how frequently those measurements appeared in the sizing information we examined.
We did not do this with every sizing system. UK columns, for example, weren’t always captured because they weren’t necessary for the original Italian-to-US comparison.
For that reason, we don’t use the number of UK entries in our dataset to estimate how frequently Italian brands publish UK sizing.
This prevents our own data-collection choices from being presented as findings about the brands themselves.
One Important Limitation
This study analyzes published size charts, not the physical dimensions or fit of the shoes themselves.
A brand listing US 9 as size 42 doesn’t necessarily mean every size 42 shoe it makes will fit identically. Construction, last shape, width, toe-box shape, materials, and individual models can all affect how a shoe fits.
What we are measuring here is narrower:
How consistently do Italian footwear brands convert their published shoe sizes, and how consistently do their published foot-length measurements agree?
How Often Do Italian Shoe Brands Agree on US Sizes?
When several Italian footwear brands list the same US size, how often do they agree on its Italian or European equivalent?
Across the 22 common men’s and women’s US sizes we analyzed, the median agreement on the most common conversion was 80.0%.
So there is a clear pattern behind Italian to US shoe size conversion charts. Many brands cluster around the same conversions, but the level of agreement changes depending on the size.
But 80% agreement also leaves plenty of room for exceptions.
Men’s Median Agreement Was 77.8%
Across the men’s sizes in our common-size analysis, the median agreement rate was 77.8%.
At US men’s 10, for example, 15 of the 16 eligible brands used size 43. That’s an agreement rate of 93.8%.
But at US men’s 7.5, only 12 of 19 eligible brands used the most common equivalent, size 40.5. Agreement dropped to 63.2%.
That’s a difference of more than 30 percentage points depending on which US men’s size you’re converting.
Women’s Median Agreement Was 82.4%
Across US women’s sizes 6 through 11, the median agreement rate was 82.4%, compared with 77.8% for men.
The lowest agreement rate we found was 76.2%, while the highest was 85.0%.
That’s a range of less than 9 percentage points, compared with more than 30 percentage points in the men’s results.
But when we’re looking strictly at how often brands choose the same Italian/European equivalent for a US size, the women’s results in our dataset were more tightly grouped.
Men’s Italian to US Shoe Size Conversions: What the Data Shows
Across the men’s sizes we analyzed, the most common conversion usually accounted for a clear majority of eligible brands. But the agreement rate moved from 63.2% to 93.8% depending on the US size.
Here are the complete results:
| US Men’s Size | Most Common Italian/European Size | Brands Using It | Eligible Brands | Agreement |
|---|---|---|---|---|
| 7 | 40 | 13 | 18 | 72.2% |
| 7.5 | 40.5 | 12 | 19 | 63.2% |
| 8 | 41 | 15 | 19 | 78.9% |
| 8.5 | 41.5 | 13 | 16 | 81.2% |
| 9 | 42 | 15 | 17 | 88.2% |
| 9.5 | 42.5 | 14 | 18 | 77.8% |
| 10 | 43 | 15 | 16 | 93.8% |
| 10.5 | 43.5 | 12 | 17 | 70.6% |
| 11 | 44 | 15 | 20 | 75.0% |
| 11.5 | 44.5 | 13 | 17 | 76.5% |
| 12 | 45 | 12 | 15 | 80.0% |
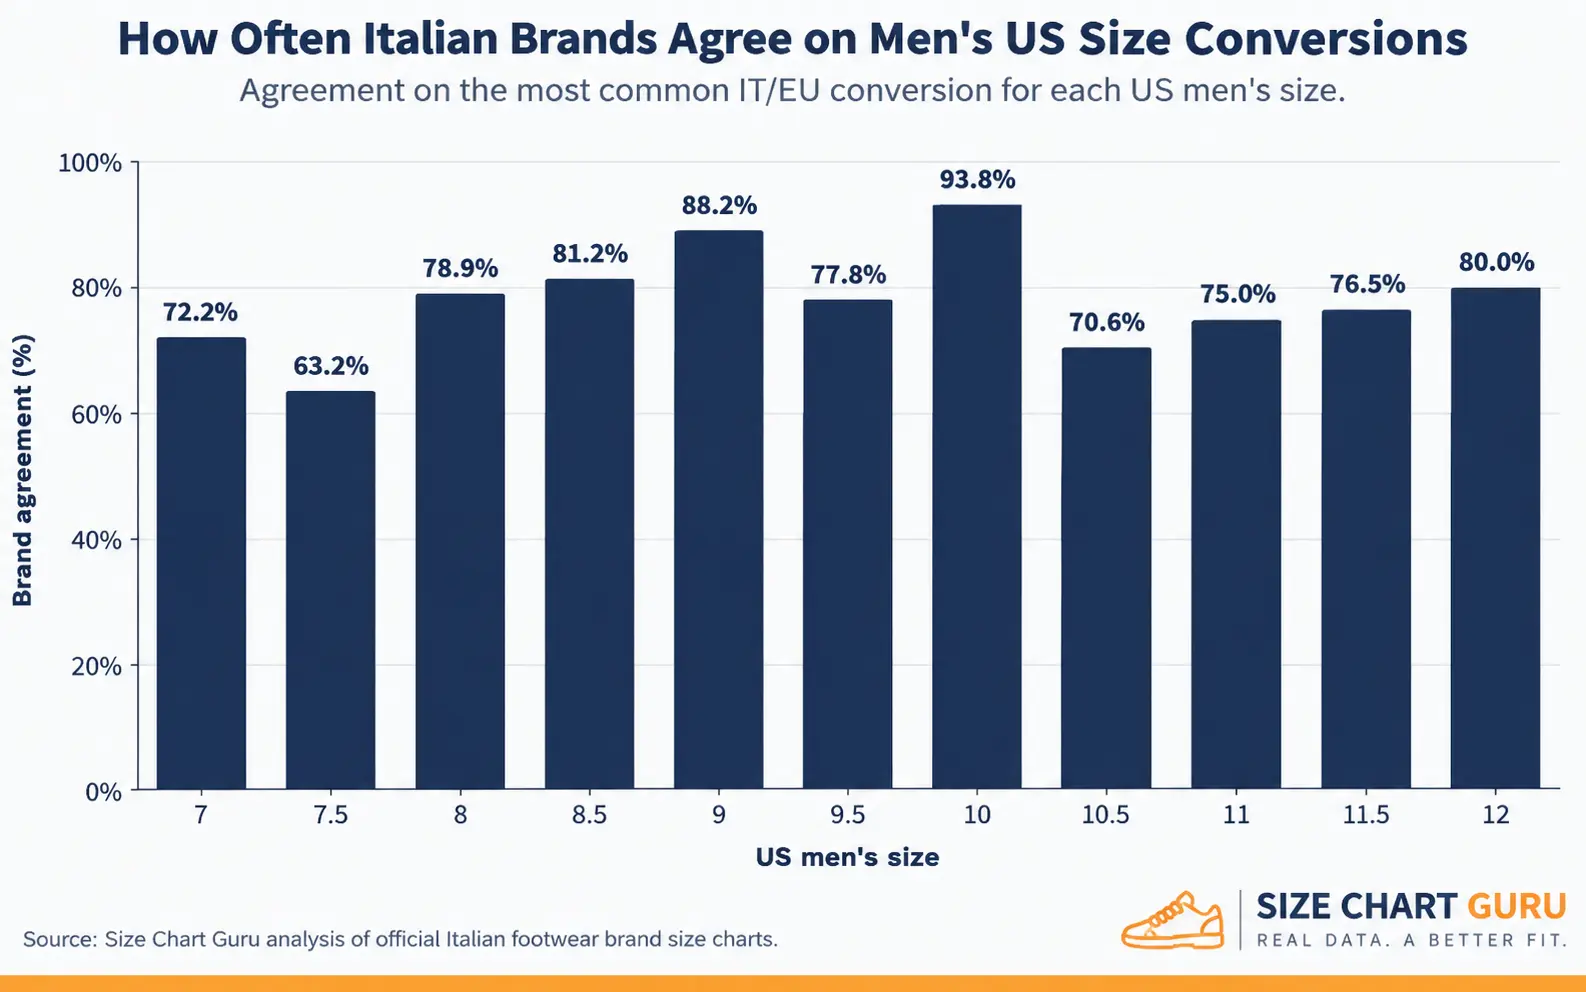
The median agreement across these men’s sizes was 77.8%.
But the table also shows why that median shouldn’t be interpreted as a fixed level of reliability. Some conversions were much more widely shared across brands than others.
US Men’s 10 Had the Highest Agreement
The strongest agreement we found was at US men’s 10.
Of the 16 eligible brands at this size, 15 converted US 10 to size 43.
That’s an agreement rate of 93.8%.
It was also one of the tightest sizes when we looked beyond the most common answer.
The continental equivalents observed for US 10 ranged from 43 to 43.5, a spread of only half a size.
US men’s 10 combined the highest agreement rate in the men’s data with the smallest continental-size spread.
US Men’s 7.5 Had the Lowest Agreement
The picture was very different at US men’s 7.5.
The most common equivalent was size 40.5, but only 12 of the 19 eligible brands used it.
That’s an agreement rate of 63.2%, the lowest of any men’s size in our common-size analysis.
The continental equivalents at US 7.5 ranged from 39.5 to 41, giving us a 1.5-size spread.
And this wasn’t simply a half-size problem.
US men’s 8.5, another half size, had 81.2% agreement, while US men’s 10.5 fell to 70.6%. Whole sizes varied too, from 72.2% at US 7 all the way to 93.8% at US 10.
That’s one reason our data doesn’t support a simple rule that half sizes are inherently less consistent.
How Much Did Men’s Italian/European Sizes Vary?
Agreement percentage tells us how many brands chose the most common conversion. It doesn’t tell us how far the remaining brands were from it.
So we also measured the full range of continental sizes associated with each US men’s size.
| US Men’s Size | Lowest IT/EU | Highest IT/EU | Spread |
|---|---|---|---|
| 7 | 39 | 40.5 | 1.5 |
| 7.5 | 39.5 | 41 | 1.5 |
| 8 | 40 | 41.5 | 1.5 |
| 8.5 | 41 | 42.5 | 1.5 |
| 9 | 42 | 43 | 1.0 |
| 9.5 | 42 | 43.5 | 1.5 |
| 10 | 43 | 43.5 | 0.5 |
| 10.5 | 43.5 | 45 | 1.5 |
| 11 | 44 | 45.5 | 1.5 |
| 11.5 | 44.5 | 46 | 1.5 |
| 12 | 45 | 46 | 1.0 |
A 1.5-size spread appeared at eight of the eleven men’s sizes we analyzed.
US men’s 10 was the clear exception, with only a 0.5-size spread, while US 9 and US 12 each had a 1-size spread.
The agreement rate tells us how strongly brands cluster around the most common conversion.
The size spread tells us how far apart the published conversions can get.
Both matter. A conversion can have a clear majority while still having outlying brands far enough away to matter when you’re actually choosing a shoe size.
Women’s Italian to US Shoe Size Conversions: What the Data Shows
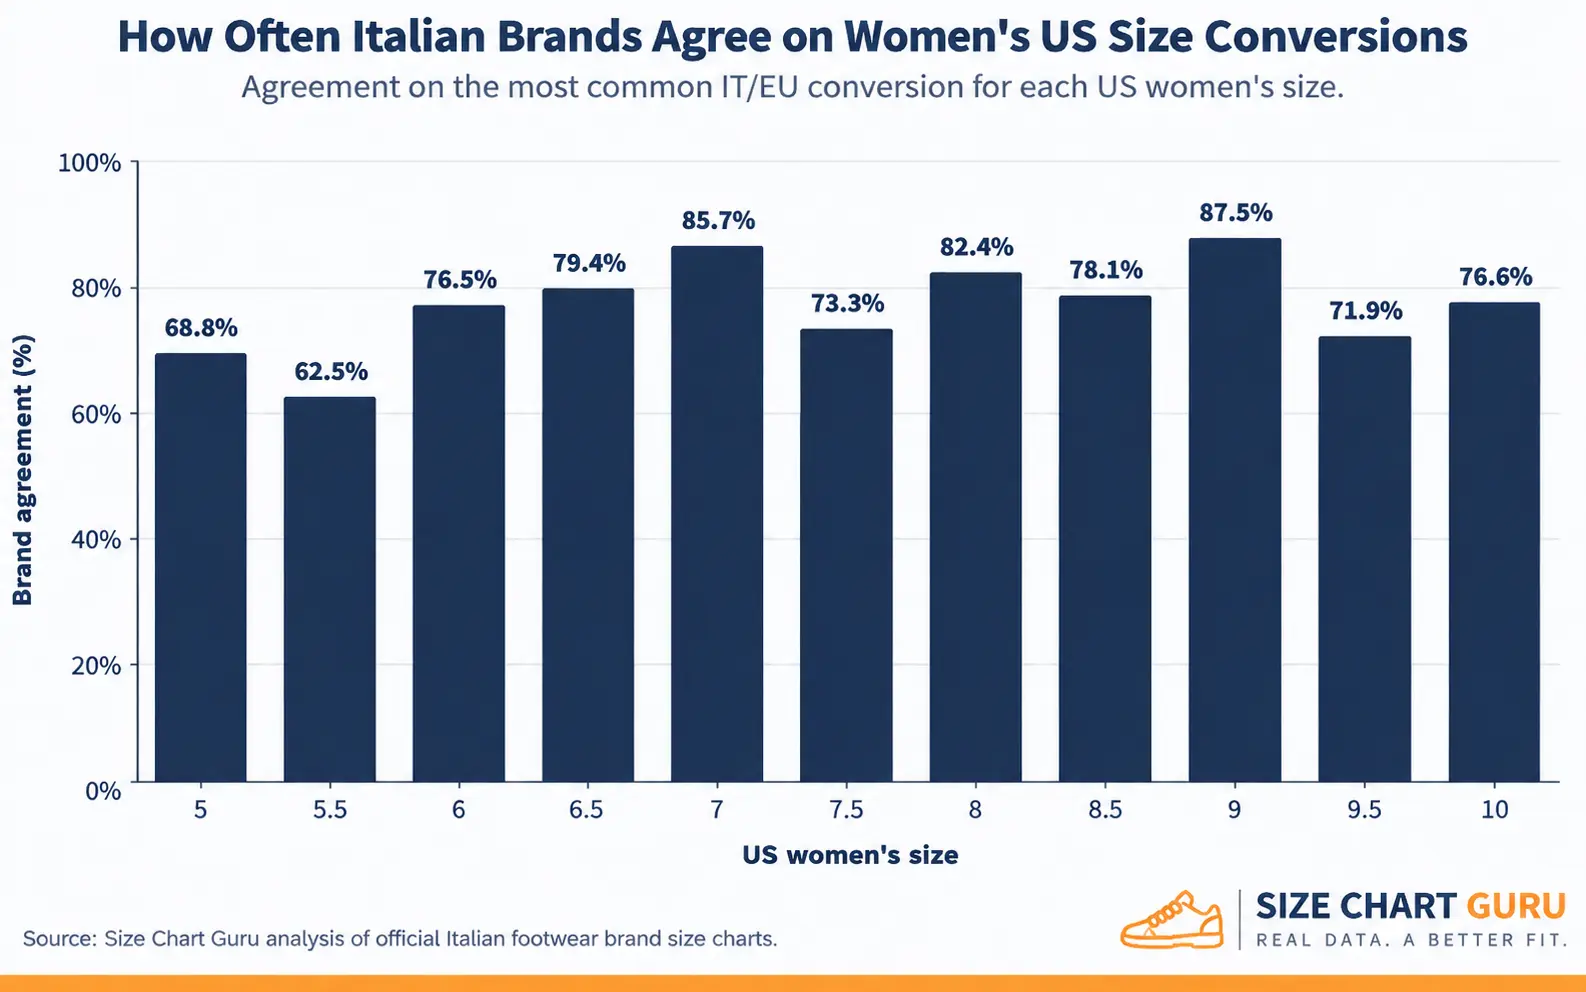
The women’s results were more consistent from one size to the next than the men’s.
Across US women’s sizes 6 through 11, the median agreement on the most common Italian/European conversion was 82.4%.
More importantly, there were no dramatic drops like the 63.2% agreement we found at US men’s 7.5. Women’s agreement stayed within a relatively narrow range of 76.2% to 85.0%.
Here is the size-by-size breakdown:
| US Women’s Size | Most Common Italian/European Size | Brands Using It | Eligible Brands | Agreement |
|---|---|---|---|---|
| 6 | 36 | 17 | 20 | 85.0% |
| 6.5 | 36.5 | 14 | 17 | 82.4% |
| 7 | 37 | 16 | 20 | 80.0% |
| 7.5 | 37.5 | 15 | 18 | 83.3% |
| 8 | 38 | 16 | 21 | 76.2% |
| 8.5 | 38.5 | 15 | 19 | 78.9% |
| 9 | 39 | 16 | 21 | 76.2% |
| 9.5 | 39.5 | 15 | 18 | 83.3% |
| 10 | 40 | 16 | 19 | 84.2% |
| 10.5 | 40.5 | 14 | 17 | 82.4% |
| 11 | 41 | 16 | 20 | 80.0% |
Women’s Agreement Was More Consistent Across Sizes
The highest agreement occurred at US women’s 6, where 17 of 20 eligible brands, or 85.0%, used size 36.
At the other end, US women’s 8 and US women’s 9 both had 76.2% agreement.
For US 8, 16 of 21 eligible brands used size 38.
For US 9, 16 of 21 used size 39.
So there was still meaningful brand-to-brand variation. But unlike the men’s results, there wasn’t one size that suddenly broke away from the rest.
The difference between the highest and lowest women’s agreement rates was 8.8 percentage points.
For men, that gap was 30.6 percentage points.
How Much Did Women’s Italian/European Sizes Vary?
Agreement percentage is only one side of the comparison.
We also looked at the lowest and highest continental equivalents published for each US women’s size.
| US Women’s Size | Lowest IT/EU | Highest IT/EU | Spread |
|---|---|---|---|
| 6 | 36 | 37 | 1.0 |
| 6.5 | 36.5 | 37.5 | 1.0 |
| 7 | 37 | 38 | 1.0 |
| 7.5 | 37.5 | 39 | 1.5 |
| 8 | 38 | 39.5 | 1.5 |
| 8.5 | 38.5 | 40 | 1.5 |
| 9 | 39 | 41 | 2.0 |
| 9.5 | 39.5 | 41 | 1.5 |
| 10 | 40 | 42 | 2.0 |
| 10.5 | 40.5 | 42.5 | 2.0 |
| 11 | 41 | 43 | 2.0 |
Although women’s agreement rates were more stable, the total range of published continental equivalents actually became wider toward the larger sizes in our analysis.
US women’s 6, 6.5, and 7 each had a 1-size spread.
At US 7.5 through 9.5, the spread was generally 1.5 sizes, apart from US 9, where it reached 2 sizes.
Then at US 10, 10.5, and 11, the observed spread was 2 full continental sizes.
Women’s brands were relatively consistent in how often they chose the most common conversion, but some of the brands outside that majority were far enough away to create a sizeable overall range.
Are Half-Size Conversions Less Consistent?
It would be an easy assumption to make. If a US half size falls between two common Italian or European sizes, you might expect brands to handle that conversion less consistently.
But that’s not what we found.
In the men’s data, some half sizes had relatively low agreement. US 7.5 had the lowest agreement of any men’s size we analyzed at 63.2%, and US 10.5 was also relatively low at 70.6%.
US men’s 8.5 had 81.2% agreement, which was higher than several of the whole sizes. US men’s 9.5 came in at 77.8%, almost exactly at the men’s median.
US women’s 7.5 and 9.5 both had 83.3% agreement. US 6.5 and 10.5 were both at 82.4%.
All four of those half sizes had higher agreement than US women’s 8 and US women’s 9, which were both at 76.2%.
So the data doesn’t support a simple rule that:
- whole sizes = more consistent
- half sizes = less consistent
How Much Do Published Foot-Length Measurements Vary?
Many of the brands in our dataset also published a foot-length measurement in centimeters.
Instead of asking:
“What Italian or European size does this US size convert to?”
we could ask:
“What foot length does each brand associate with this US size?”
Across the common sizes we analyzed, the largest observed spread was 1.7 cm for men and 2.6 cm for women.
These figures refer to the foot-length measurements published in the brands’ size charts. They do not mean that the shoes themselves differed internally by 1.7 or 2.6 cm.
Men’s Foot-Length Differences
The men’s published measurements varied at every common US size we analyzed.
| US Men’s Size | Brands With Foot-Length Data | Lowest Foot Length | Highest Foot Length | Difference |
|---|---|---|---|---|
| 7 | 16 | 25.0 cm | 26.7 cm | 1.7 cm |
| 7.5 | 14 | 25.5 cm | 27.0 cm | 1.5 cm |
| 8 | 16 | 25.9 cm | 27.3 cm | 1.4 cm |
| 8.5 | 14 | 26.3 cm | 27.7 cm | 1.4 cm |
| 9 | 16 | 26.7 cm | 28.0 cm | 1.3 cm |
| 9.5 | 14 | 27.1 cm | 28.3 cm | 1.2 cm |
| 10 | 16 | 27.5 cm | 28.7 cm | 1.2 cm |
| 10.5 | 14 | 27.9 cm | 29.0 cm | 1.1 cm |
| 11 | 15 | 28.3 cm | 29.5 cm | 1.2 cm |
| 11.5 | 13 | 28.6 cm | 30.0 cm | 1.4 cm |
| 12 | 16 | 29.0 cm | 30.7 cm | 1.7 cm |
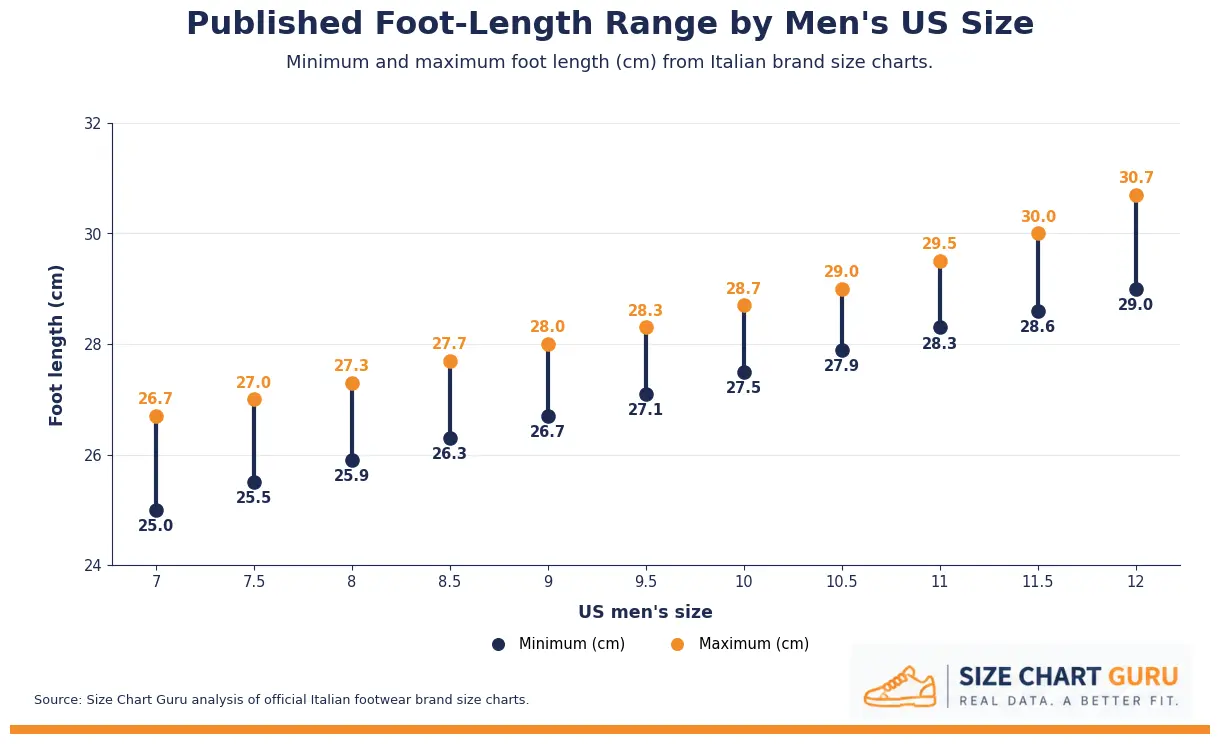
The largest men’s differences occurred at US 7 and US 12, where the published measurements spanned 1.7 cm.
Even at US men’s 10, where we found very strong agreement on the nominal conversion to size 43, the published foot-length values ranged from 27.5 to 28.7 cm.
That’s a 1.2 cm difference despite the unusually high 93.8% agreement on the most common size conversion.
Brands can agree on the size labels without necessarily assigning the same foot measurement to those labels.
Women’s Foot-Length Differences
The women’s measurements varied even more.
| US Women’s Size | Brands With Foot-Length Data | Lowest Foot Length | Highest Foot Length | Difference |
|---|---|---|---|---|
| 6 | 14 | 22.0 cm | 24.3 cm | 2.3 cm |
| 6.5 | 11 | 22.5 cm | 24.3 cm | 1.8 cm |
| 7 | 14 | 23.0 cm | 25.4 cm | 2.4 cm |
| 7.5 | 12 | 23.0 cm | 25.1 cm | 2.1 cm |
| 8 | 14 | 23.5 cm | 26.0 cm | 2.5 cm |
| 8.5 | 12 | 23.5 cm | 25.8 cm | 2.3 cm |
| 9 | 14 | 24.0 cm | 26.6 cm | 2.6 cm |
| 9.5 | 12 | 24.5 cm | 26.63 cm | 2.13 cm |
| 10 | 13 | 25.0 cm | 27.1 cm | 2.1 cm |
| 10.5 | 11 | 25.5 cm | 27.5 cm | 2.0 cm |
| 11 | 13 | 26.0 cm | 28.0 cm | 2.0 cm |
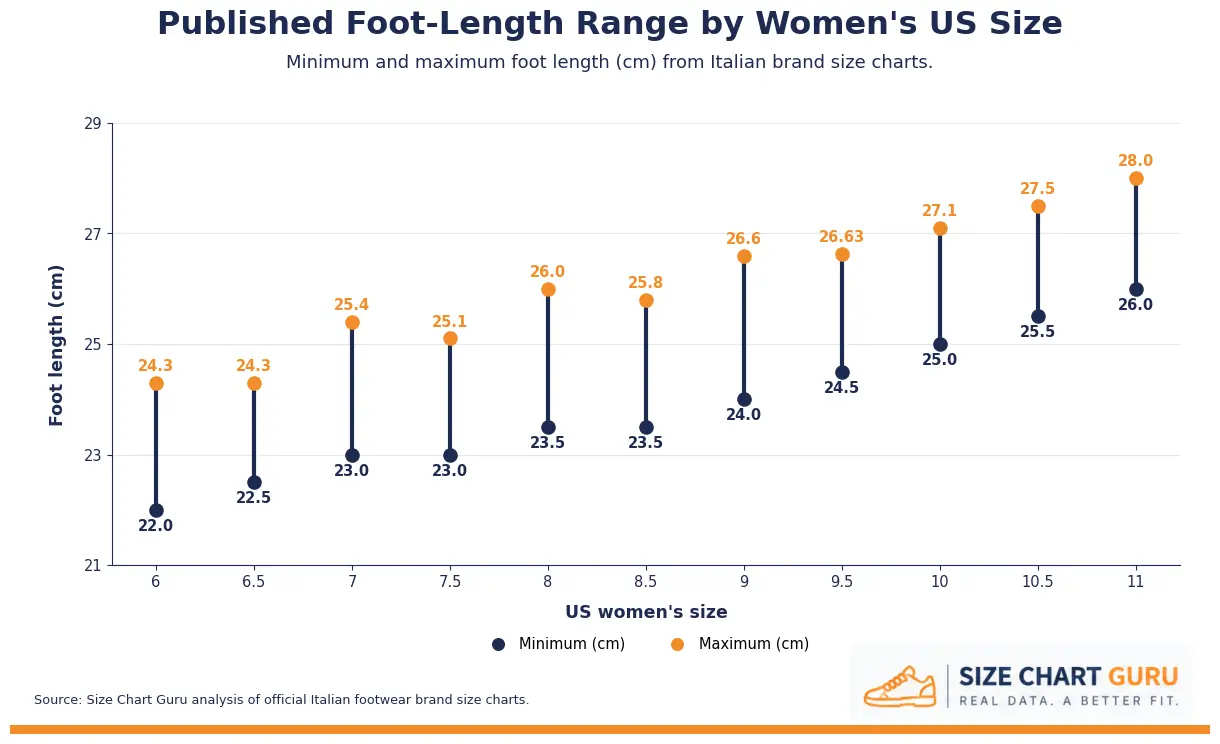
The largest difference appeared at US women’s 9.
Among the brands with centimeter data at that size, published foot lengths ranged from 24.0 to 26.6 cm, a difference of 2.6 cm.
US women’s 8 was close behind at 2.5 cm, while US 7 had a 2.4 cm difference.
Two brands could label US women’s 9 differently, for example, size 39 at one brand and size 40 at another. That could partly explain why their centimeter measurements differ.
What Happens When Both Size Labels Are the Same?
The foot-length differences in the previous section include brands that didn’t always agree on the Italian or European conversion.
This time, we only compared brands when both size labels matched.
For example, instead of comparing every brand that published a measurement for US women’s 9, we compared brands that specifically listed the same pairing:
US Women’s 9 = IT/EU 39
If different conversions were the main reason the centimeter measurements varied, we would expect those differences to become small once both labels were identical.
The differences did get smaller, but they didn’t disappear.
Same-Label Differences Reached 2.2 cm for Women
Across the women’s same-label comparisons, we still found differences of up to 2.2 cm between the published foot-length measurements.
Here is the size-by-size breakdown:
| US Women’s Size | IT/EU Size | Brands With Foot-Length Data | Lowest Foot Length | Highest Foot Length | Difference |
|---|---|---|---|---|---|
| 6 | 36 | 11 | 22.0 cm | 24.0 cm | 2.0 cm |
| 7 | 37 | 10 | 23.0 cm | 24.7 cm | 1.7 cm |
| 8 | 38 | 10 | 23.5 cm | 25.3 cm | 1.8 cm |
| 8.5 | 38.5 | 9 | 23.5 cm | 25.7 cm | 2.2 cm |
| 9 | 39 | 10 | 24.0 cm | 26.0 cm | 2.0 cm |
| 10 | 40 | 10 | 25.0 cm | 27.0 cm | 2.0 cm |
| 11 | 41 | 10 | 26.0 cm | 28.0 cm | 2.0 cm |
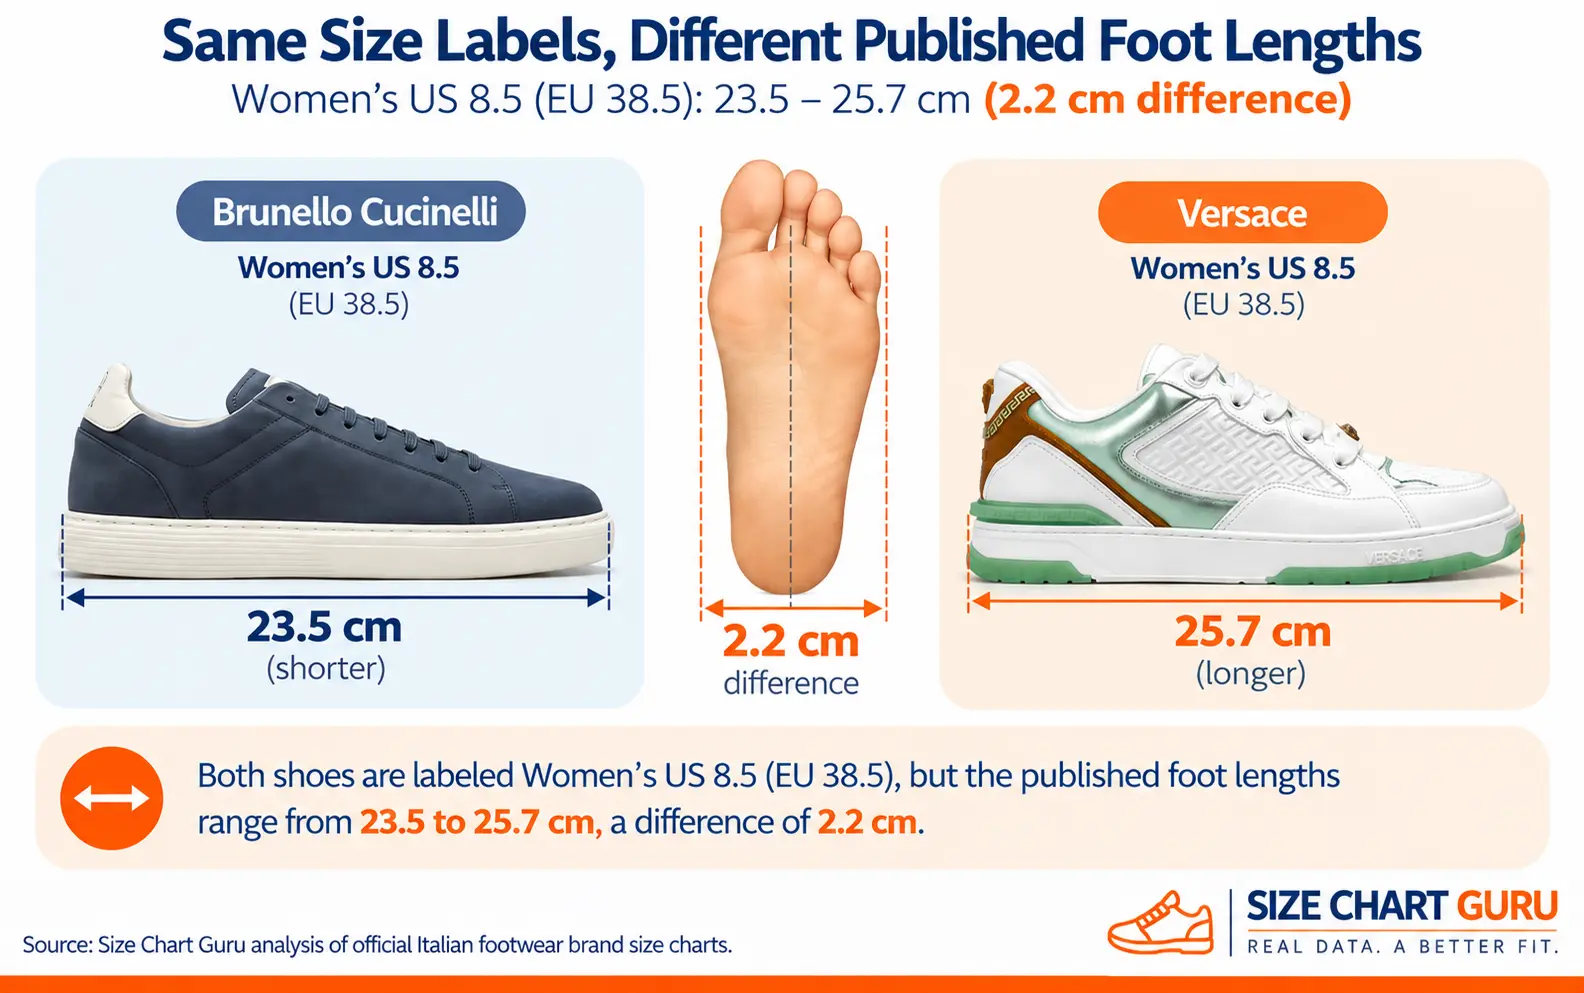
US Women’s 8.5 / Size 38.5 Had the Largest Women’s Difference
The largest same-label difference we found for women occurred at US 8.5 / IT-EU 38.5.
Nine eligible brands published centimeter measurements for that exact pairing.
Those measurements ranged from 23.5 cm to 25.7 cm.
That’s a difference of 2.2 cm, even though every brand in this comparison agreed that the shoe-size pairing itself was US 8.5 and 38.5.
US Women’s 9 / Size 39 Still Varied by 2.0 cm
For brands that agreed on:
US Women’s 9 = IT/EU 39
the published foot-length measurements ranged from 24.0 to 26.0 cm.
Ten eligible brands provided centimeter data for that exact pairing.
So even after fixing both size labels, we still found a 2.0 cm spread.
In other words, seeing the same US and Italian/European sizes on two brand charts does not guarantee that the brands are defining that pairing with the same foot-length measurement.
Men’s Same-Label Differences Reached 1.7 cm
The differences were smaller overall than they were for women, but they were still present.
| US Men’s Size | IT/EU Size | Brands With Foot-Length Data | Lowest Foot Length | Highest Foot Length | Difference |
|---|---|---|---|---|---|
| 7 | 40 | 10 | 25.0 cm | 26.7 cm | 1.7 cm |
| 8 | 41 | 11 | 25.9 cm | 27.3 cm | 1.4 cm |
| 9 | 42 | 11 | 26.7 cm | 28.0 cm | 1.3 cm |
| 10 | 43 | 11 | 27.5 cm | 28.7 cm | 1.2 cm |
| 11 | 44 | 10 | 28.3 cm | 29.3 cm | 1.0 cm |
| 12 | 45 | 9 | 29.0 cm | 30.0 cm | 1.0 cm |
At US men’s 7 / size 40, published foot lengths ranged from 25.0 to 26.7 cm, a difference of 1.7 cm.
At US 8 / size 41, the difference was 1.4 cm, and at US 9 / size 42 it was 1.3 cm.
Again, these are differences in the measurements the brands publish for a foot, not measurements of the internal length of their shoes.
Men’s Measurement Differences Narrowed at Larger Sizes
The spread generally became smaller as we moved through the sizes in this comparison.
It was 1.7 cm at US 7 / size 40, then 1.4 cm at US 8 / size 41, 1.3 cm at US 9 / size 42, and 1.2 cm at US 10 / size 43.
At both US 11 / size 44 and US 12 / size 45, the difference was 1.0 cm.
We wouldn’t turn that into a general rule about all Italian footwear. But within the sizes and brands included in this dataset, the pattern is visible.
Can Sizing Change Within the Same Brand?
So far, most of the differences we’ve looked at have been between brands. But some brands publish separate size charts for different types of footwear, which let us compare sizing information within the same brand.
With Dolce & Gabbana, the US-to-Italian/European conversion stayed the same, but some of the published foot-length measurements changed.
With Premiata, the US conversion itself changed between product lines.
Dolce & Gabbana: Same Conversion, Different Foot-Length Measurements
Dolce & Gabbana published separate men’s sizing information for formal shoes and sneakers.
The size conversion was consistent between the two charts, but the centimeter measurements didn’t always match.
The differences appeared mainly at the half sizes.
| IT/EU Size | US Size | Formal Shoes | Sneakers | Difference |
|---|---|---|---|---|
| 39 | 6 | 24.5 cm | 24.5 cm | 0 cm |
| 39.5 | 6.5 | 24.9 cm | 24.7 cm | 0.2 cm |
| 40 | 7 | 25.3 cm | 25.3 cm | 0 cm |
| 40.5 | 7.5 | 25.7 cm | 25.5 cm | 0.2 cm |
| 41 | 8 | 26.1 cm | 26.1 cm | 0 cm |
| 41.5 | 8.5 | 26.5 cm | 26.3 cm | 0.2 cm |
| 42 | 9 | 26.9 cm | 26.9 cm | 0 cm |
| 42.5 | 9.5 | 27.3 cm | 27.1 cm | 0.2 cm |
| 43 | 10 | 27.7 cm | 27.7 cm | 0 cm |
| 43.5 | 10.5 | 28.1 cm | 27.9 cm | 0.2 cm |
| 44 | 11 | 28.5 cm | 28.5 cm | 0 cm |
| 44.5 | 11.5 | 28.9 cm | 28.7 cm | 0.2 cm |
| 45 | 12 | 29.3 cm | 29.3 cm | 0 cm |
| 45.5 | 12.5 | 29.7 cm | 29.5 cm | 0.2 cm |
| 46 | 13 | 30.1 cm | 30.1 cm | 0 cm |
| 46.5 | 13.5 | 30.5 cm | 30.3 cm | 0.2 cm |
| 47 | 14 | 30.9 cm | 30.9 cm | 0 cm |
Dolce & Gabbana’s Half Sizes Showed a Consistent 0.2 cm Difference
From size 39.5 through 46.5, every listed half size had the same difference: the formal-shoe chart assigned a foot length 0.2 cm longer than the sneaker chart.
The corresponding whole sizes from 39 through 47 matched exactly.
But size 42.5 was US 9.5 on both charts while the published measurement changed from 27.3 cm for formal shoes to 27.1 cm for sneakers.
Premiata: The US Conversion Itself Changes by Product Line
Its men’s Heritage and Sneakers charts didn’t always assign the same US size to the same European size.
| EU Size | Heritage US Size | Sneakers US Size | US Size Difference |
|---|---|---|---|
| 39 | 6 | 6.5 | 0.5 |
| 40 | 7 | 7 | 0 |
| 41 | 8 | 8 | 0 |
| 42 | 9 | 9 | 0 |
| 43 | 10 | 10 | 0 |
| 44 | 11 | 10.5 | 0.5 |
| 45 | 12 | 11.5 | 0.5 |
| 46 | 13 | 12 | 1.0 |
| 47 | 14 | 12.5 | 1.5 |
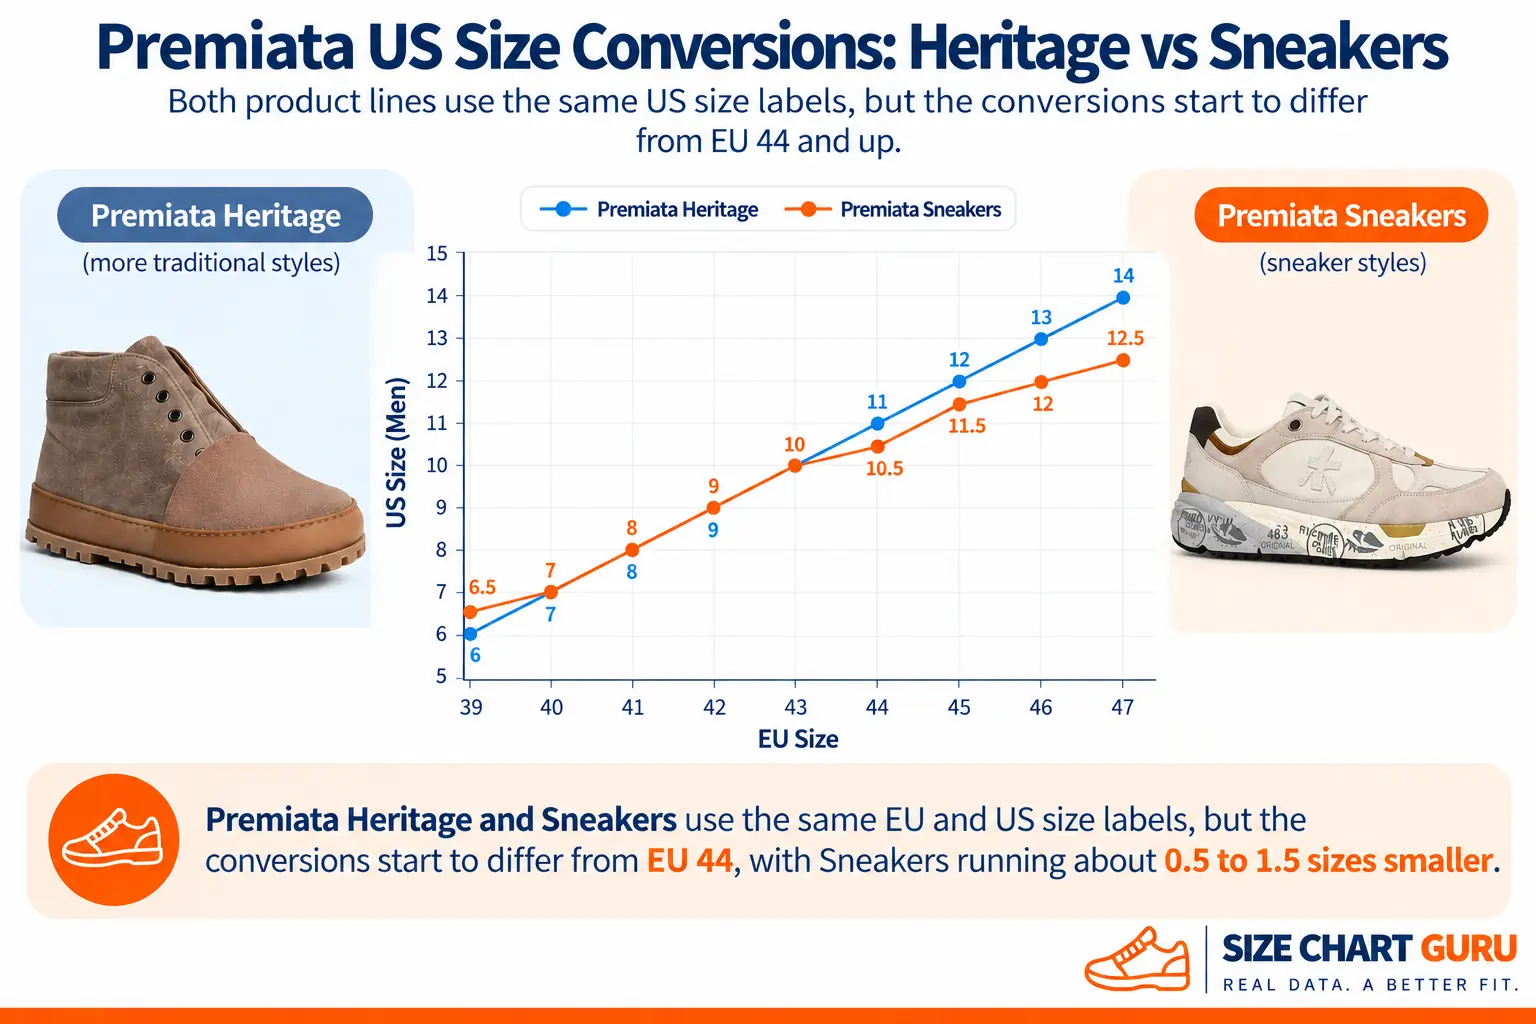
The two product lines matched from EU 40 through 43, but the gap began to widen from EU 44 onward. By EU 46, Heritage listed US 13 while Sneakers listed US 12, a full US-size difference.
Premiata’s Difference Reached 1.5 US Sizes
The largest difference appeared at EU 47, which Heritage converted to US men’s 14 and Sneakers to US men’s 12.5. That’s a difference of 1.5 US sizes within the same brand.
This doesn’t mean one chart is wrong. It means the product line matters when interpreting the sizing information the brand publishes.
What Sizing Information Do Italian Shoe Brands Provide?
We also looked at what sizing information the 26 brands actually published in the data we collected. Because we didn’t systematically record every possible sizing field, we only calculated percentages for the information we consistently captured across the dataset.
| Sizing Information | Brands | Percentage |
|---|---|---|
| Clean US conversion usable in our analysis | 23 of 26 | 88.5% |
| Foot length in centimeters | 20 of 26 | 76.9% |
| Foot length in inches | 11 of 26 | 42.3% |
| Both men’s and women’s sizing represented | 21 of 26 | 80.8% |
| Proprietary brand-size field | 6 of 26 | 23.1% |
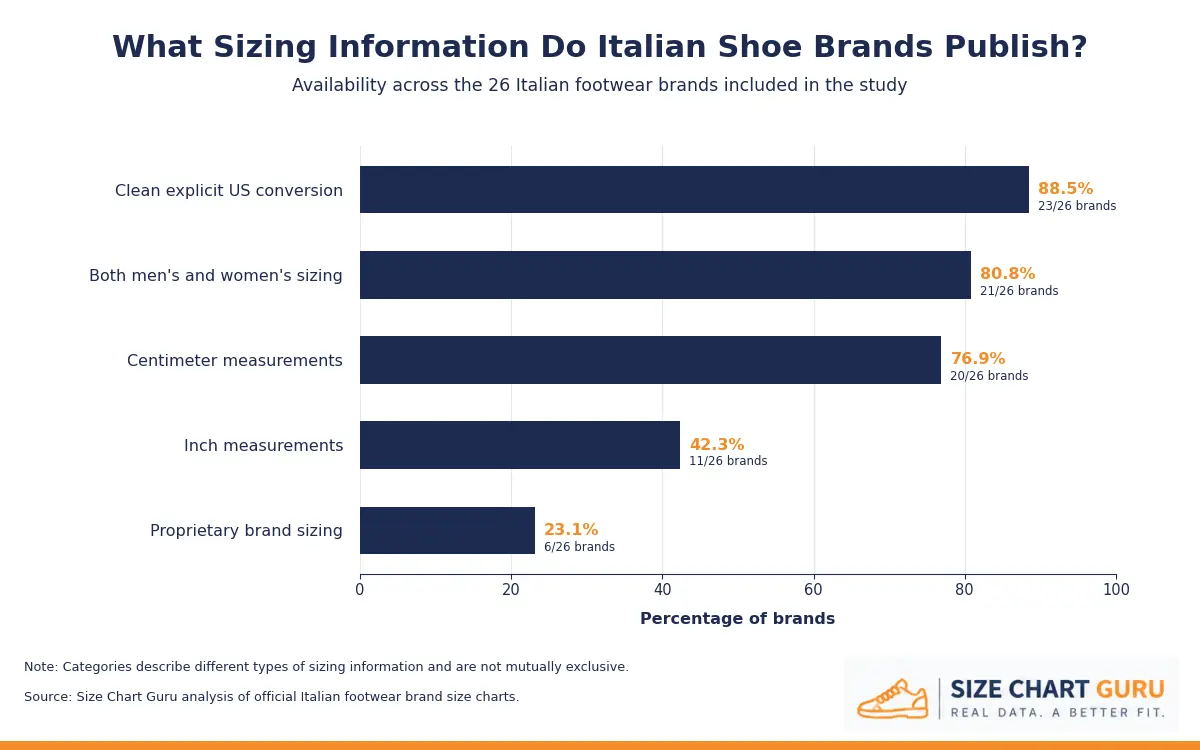
88.5% Provided a Clean US Conversion
Of the 26 brands in our dataset, 23, or 88.5%, provided US sizing information that we could use confidently in the exact-conversion analysis.
The remaining charts weren’t automatically treated as missing US sizing. In some cases, the problem was that the labeling was ambiguous or combined with another sizing system.
Rather than guessing what those values meant, we left them out of calculations that required a clearly identifiable US size.
76.9% Provided Centimeter Measurements
20 of the 26 brands, or 76.9%, included usable centimeter measurements in the sizing information we collected.
If we had looked only at the US and Italian/European labels, we would have missed some of the largest differences in the dataset.
As we saw earlier, even brands using the exact same size pairing could publish foot-length measurements that differed by more than 2 cm.
42.3% Provided Measurements in Inches
Inches were considerably less common.
Only 11 of the 26 brands included inch measurements, giving us a rate of 42.3%.
We preserved the inch and centimeter values as the brands published them rather than recalculating one from the other. That matters because a brand’s published inch value does not always convert perfectly back to its published centimeter value after rounding.
80.8% Had Both Men’s and Women’s Sizing in Our Dataset
We had both men’s and women’s sizing data for 21 of the 26 brands, or 80.8%.
That gave us enough coverage to analyze the two groups separately rather than assuming the same level of consistency applied to both.
23.1% Included a Proprietary Brand Size
Finally, 6 of the 26 brands, or 23.1%, included their own brand-specific size field alongside other sizing systems in the data we collected.
A shopper may encounter a standard-looking IT or EU number on one chart, while another brand may place its own sizing system alongside US, European, or foot-length information.
What Does This Mean for Italian to US Shoe Size Conversion Charts?
General Italian-to-US conversion charts have a real basis in the data.
Across the 22 common men’s and women’s sizes we analyzed, the median agreement on the most common conversion was 80.0%.
The problem comes when a general chart is treated as if it were exact for every brand.
If you’re converting in the other direction, our US to European shoe size conversion guide covers the standard US-to-EU equivalents for men and women.
Generic Conversion Charts Are Useful Starting Points
If you don’t know the brand yet, a general conversion chart can give you a reasonable starting point.
For example, our data found that:
- US men’s 8 most commonly converted to size 41, with 78.9% agreement.
- US men’s 9 most commonly converted to size 42, with 88.2% agreement.
- US men’s 10 most commonly converted to size 43, with 93.8% agreement.
- US women’s 8 most commonly converted to size 38, with 76.2% agreement.
- US women’s 9 most commonly converted to size 39, with 76.2% agreement.
- US women’s 10 most commonly converted to size 40, with 84.2% agreement.
Those patterns explain why the familiar conversions used in general charts appear so often. But none of the agreement rates was 100%.
A generic chart can tell you the size you’re likely to be. It can’t guarantee what a specific brand will recommend.
Brand-Specific Charts Should Take Priority
Once you know which brand you’re buying, the brand’s own chart becomes more useful than a general conversion.
At US men’s 7.5, for example, the most common conversion was size 40.5, but the published continental equivalents ranged from 39.5 to 41.
For US women’s 9, size 39 was the most common answer, but the observed range stretched from 39 to 41.
A generic chart has to choose one answer. Individual brand charts don’t necessarily make the same choice.
We found cases where brands agreed on both the US and Italian/European size labels while publishing substantially different foot-length measurements for that exact pairing.
For US women’s 9 / size 39, for example, published foot-length measurements ranged from 24.0 to 26.0 cm among the eligible brands in that comparison.
So when a brand publishes both a size conversion and a foot-length measurement, check both rather than relying on the conversion alone.
Sometimes You Need the Product-Specific Chart
A brand-level chart isn’t always the most specific sizing information available.
Dolce & Gabbana’s men’s formal-shoe and sneaker charts used the same US conversions in the data we compared, but some of their published foot-length measurements differed.
Premiata went further. Its Heritage and Sneakers charts sometimes assigned different US sizes to the same European size.
At EU 47, the difference reached 1.5 US sizes.
That means the useful order of reference is:
general conversion chart → brand chart → product-specific chart
How to Use Italian Shoe Sizing in Practice
A general conversion is useful when you need a starting point. Once you know which shoes you’re buying, more specific sizing information becomes more useful.
1. If You Know the Brand, Start With Its Size Chart
If you’ve already chosen the brand, check its size chart first.
You don’t need to convert your US size using a general chart and then compare the result with the brand’s conversion. The brand’s own sizing information is the more relevant reference for its shoes.
If you haven’t chosen a brand yet, a general conversion chart can help you estimate the Italian or European size you’re likely to encounter.
2. Check for a Product-Specific Size Chart
Don’t assume one brand chart applies to every shoe the company makes.
If the brand provides a separate chart for sneakers, formal shoes, boots, or the particular product you’re considering, use that chart rather than its general sizing information.
3. Use Foot Length When It’s Available
If the brand publishes a foot-length measurement, compare it with your own measurement as another point of reference.
If you don’t know your measurement, here’s how to measure your feet at home.
Just remember that a published foot-length value is not the internal length of the shoe. It represents the foot measurement the brand associates with that size.
If the brand doesn’t provide foot length, don’t borrow a centimeter measurement from another brand simply because the size labels are the same. Use the sizing information the brand actually provides.
4. If There Is No Clear US Conversion, Don’t Guess One
Some charts don’t provide a clear US equivalent.
If that’s the case, work with the information the brand does provide, such as its Italian or European sizing and foot-length measurements.
Don’t assume an ambiguous number represents US, IT, EU, or foot length unless the brand identifies it that way.
5. If You’re Between Sizes, Don’t Automatically Size Up or Down
There isn’t a universal rule that says you should always take the larger or smaller size.
Check whether the brand provides guidance for the particular shoe, then consider your foot shape, shoe width, and how you prefer your shoes to fit.
If width is part of the decision, our sneaker width guide and boot width guide explain how width sizing works.
6. When Information Conflicts, Use the Most Specific Reliable Source
If a general conversion and the brand’s chart give different answers, use the brand’s information. If the brand also provides sizing specifically for the shoe or product category you’re buying, use that instead.
A simple way to think about it is:
Product-specific size chart → brand size chart → general conversion chart
Foot-length information can then be used alongside the relevant chart when the brand provides it.
What Not to Do
- Don’t assume every Italian brand converts US sizes the same way.
- Don’t assume IT, EU, Europe, and proprietary brand sizes are automatically interchangeable.
- Don’t treat a published foot-length measurement as the internal length of the shoe.
- Don’t fill in missing measurements using another brand’s chart.
- Don’t ignore a product-specific chart when one is available.
- Don’t automatically size up or down just because two charts disagree.
Study Limitations
This Is a Study of Published Size Charts
Our analysis is based on the sizing information published by the brands themselves.
We did not physically measure every shoe included in those brands’ collections, and we didn’t use customer reviews or retailer conversions to fill gaps in the data.
So when we say that two brands disagree on a conversion, we’re talking about a difference between their published size charts.
Likewise, when we report a difference in centimeters, we’re comparing the foot-length measurements the brands published, not the physical internal length of their shoes.
Not Every Brand Publishes the Same Information
Of the 26 brands in our dataset, 20 provided usable centimeter measurements, while only 11 provided measurements in inches.
For example, a brand could contribute to our US-to-Italian/European conversion analysis but not to the foot-length analysis if it didn’t publish a usable centimeter measurement.
We didn’t estimate or calculate missing values to make the dataset more complete.
The Eligible Sample Changes Depending on the Comparison
Each calculation only includes brands with the information needed for that specific comparison.
For example, US men’s 10 had 16 eligible brands in the conversion-agreement analysis, while US men’s 11 had 20.
We therefore calculate each percentage using its own eligible sample rather than using all 26 brands as the denominator for every result.
That’s why we report results such as 15 of 16 brands, or 93.8%, instead of simply saying that 93.8% of all brands in the study agreed.
Foot Length Is Not the Same as Internal Shoe Length
The measurements in this study are the foot-length values associated with sizes in the brands’ published charts, not measurements of the shoes themselves.
If one brand lists US women’s 9 / size 39 at 24.0 cm and another lists the same pairing at 26.0 cm, our finding is that their published foot-length guidance differs by 2.0 cm.
It does not mean we physically measured those two shoes and found one to be 2 cm longer inside.
IT and EU Labels Aren’t Always Presented the Same Way
Depending on the source, we encountered labels such as IT, EU, Europe, and IT/EU, as well as proprietary brand sizing.
We preserved those original labels in the underlying dataset rather than automatically rewriting everything as “Italian sizing.”
For the cross-brand numerical comparisons, we only standardized continental size values when the source gave us enough information to make that comparison confidently.
If a column was ambiguous, combined two sizing systems, or couldn’t be interpreted confidently, we didn’t force it into a calculation simply to increase the sample size.
Data Sources
The data analyzed in this study was collected from sizing information published by the brands themselves. Where a brand provided a dedicated shoe size guide, we used that guide. When sizing information was available through individual product pages instead, we used the sizing chart or size guide displayed on those pages.
Because brands can update their websites, product pages, and sizing information over time, the links below reflect the sources used during our data collection.
- Gucci: Official Shoe Size Guide
- Ferragamo: Official Shoe Size Guide
- Bottega Veneta: Women’s Product Page | Men’s Product Page
- Brunello Cucinelli: Men’s Product Page | Women’s Product Page
- Tod’s: Men’s Product Page | Women’s Product Page
- Dolce & Gabbana: Women’s Product Page | Men’s Product Page
- Valentino: Women’s Size Guide | Men’s Size Guide
- Versace: Women’s Shoe Size Guide | Men’s Shoe Size Guide
- Golden Goose: Official Size Guide
- Santoni: Men’s Product Page | Women’s Product Page
- Velasca: Women’s Product Page and Size Guide
- Diemme: Product Page and Size Guide
- Scarosso: Sizing Document
- Prada: Official Website
- Giorgio Armani: Official Website
- Superga: Official Size Chart
- Zegna: Men’s Product Page
- Miu Miu: Women’s Product Page
- Sergio Rossi: Official Size and Care Guide
- Premiata: Men’s Heritage Product Page | Men’s Sneakers Product Page | Women’s Sneakers Product Page
- Hogan: Official Size Guide
- Loro Piana: Men’s Product Page | Women’s Product Page
- Moschino: Men’s Product Page | Women’s Product Page
- Gianvito Rossi: Women’s Product Page | Men’s Product Page
- Stone Island: Product Page and Size Guide
- NeroGiardini: Women’s Product Page | Men’s Product Page
Complete Italian to US Shoe Size Study Results
The tables below bring together the main size-by-size results behind our analysis.
Rather than showing only the averages and standout examples, this section lets you see how many brands were eligible at each size, which Italian/European equivalent appeared most often, how strong the agreement was, and how widely the published conversions and foot-length measurements varied.
Complete Men’s Results
Across the 11 common men’s US sizes in this comparison, agreement ranged from 63.2% to 93.8%, with a median agreement rate of 77.8%.
| US Men’s Size | Most Common Italian/European Size | Brands Agreeing | Agreement Rate | IT/EU Range | Brands With Foot-Length Data | Published Foot-Length Range |
|---|---|---|---|---|---|---|
| 7 | 40 | 13 of 18 | 72.2% | 39–40.5 | 16 | 25.0–26.7 cm |
| 7.5 | 40.5 | 12 of 19 | 63.2% | 39.5–41 | 14 | 25.5–27.0 cm |
| 8 | 41 | 15 of 19 | 78.9% | 40–41.5 | 16 | 25.9–27.3 cm |
| 8.5 | 41.5 | 13 of 16 | 81.2% | 41–42.5 | 14 | 26.3–27.7 cm |
| 9 | 42 | 15 of 17 | 88.2% | 42–43 | 16 | 26.7–28.0 cm |
| 9.5 | 42.5 | 14 of 18 | 77.8% | 42–43.5 | 14 | 27.1–28.3 cm |
| 10 | 43 | 15 of 16 | 93.8% | 43–43.5 | 16 | 27.5–28.7 cm |
| 10.5 | 43.5 | 12 of 17 | 70.6% | 43.5–45 | 14 | 27.9–29.0 cm |
| 11 | 44 | 15 of 20 | 75.0% | 44–45.5 | 15 | 28.3–29.5 cm |
| 11.5 | 44.5 | 13 of 17 | 76.5% | 44.5–46 | 13 | 28.6–30.0 cm |
| 12 | 45 | 12 of 15 | 80.0% | 45–46 | 16 | 29.0–30.7 cm |
The table also shows why conversion agreement and foot-length agreement need to be treated separately. At US men’s 10, for example, the conversion agreement reached 93.8%, yet the published foot-length values still ranged from 27.5 to 28.7 cm.
Complete Women’s Results
Across the 11 common women’s US sizes analyzed, the median agreement rate was 82.4%, with individual agreement rates ranging from 76.2% to 85.0%.
| US Women’s Size | Most Common IT/EU Size | Brands Agreeing | Agreement Rate | IT/EU Range | Brands With Foot-Length Data | Published Foot-Length Range |
|---|---|---|---|---|---|---|
| 6 | 36 | 17 of 20 | 85.0% | 36–37 | 14 | 22.0–24.3 cm |
| 6.5 | 36.5 | 14 of 17 | 82.4% | 36.5–37.5 | 11 | 22.5–24.3 cm |
| 7 | 37 | 16 of 20 | 80.0% | 37–38 | 14 | 23.0–25.4 cm |
| 7.5 | 37.5 | 15 of 18 | 83.3% | 37.5–39 | 12 | 23.0–25.1 cm |
| 8 | 38 | 16 of 21 | 76.2% | 38–39.5 | 14 | 23.5–26.0 cm |
| 8.5 | 38.5 | 15 of 19 | 78.9% | 38.5–40 | 12 | 23.5–25.8 cm |
| 9 | 39 | 16 of 21 | 76.2% | 39–41 | 14 | 24.0–26.6 cm |
| 9.5 | 39.5 | 15 of 18 | 83.3% | 39.5–41 | 12 | 24.5–26.63 cm |
| 10 | 40 | 16 of 19 | 84.2% | 40–42 | 13 | 25.0–27.1 cm |
| 10.5 | 40.5 | 14 of 17 | 82.4% | 40.5–42.5 | 11 | 25.5–27.5 cm |
| 11 | 41 | 16 of 20 | 80.0% | 41–43 | 13 | 26.0–28.0 cm |
For women, the spread reached two full size numbers at US 9, 10, 10.5, and 11. At US women’s 9, for example, the brands in the analysis mapped the same US size to values ranging from 39 to 41.
The largest overall published foot-length spread in the women’s common-size results also appeared at US 9, where measurements ranged from 24.0 to 26.6 cm, a difference of 2.6 cm.
Complete Same-Label Foot-Length Results
Instead of grouping every brand that published a particular US size, we only compare brands where the US size and the Italian/European size both match.
| Group | US Size | IT/EU Size | Brands With Foot-Length Data | Lowest Published Foot Length | Highest Published Foot Length | Difference |
|---|---|---|---|---|---|---|
| Women | 6 | 36 | 11 | 22.0 cm | 24.0 cm | 2.0 cm |
| Women | 7 | 37 | 10 | 23.0 cm | 24.7 cm | 1.7 cm |
| Women | 8 | 38 | 10 | 23.5 cm | 25.3 cm | 1.8 cm |
| Women | 8.5 | 38.5 | 9 | 23.5 cm | 25.7 cm | 2.2 cm |
| Women | 9 | 39 | 10 | 24.0 cm | 26.0 cm | 2.0 cm |
| Women | 10 | 40 | 10 | 25.0 cm | 27.0 cm | 2.0 cm |
| Women | 11 | 41 | 10 | 26.0 cm | 28.0 cm | 2.0 cm |
| Men | 7 | 40 | 10 | 25.0 cm | 26.7 cm | 1.7 cm |
| Men | 8 | 41 | 11 | 25.9 cm | 27.3 cm | 1.4 cm |
| Men | 9 | 42 | 11 | 26.7 cm | 28.0 cm | 1.3 cm |
| Men | 10 | 43 | 11 | 27.5 cm | 28.7 cm | 1.2 cm |
| Men | 11 | 44 | 10 | 28.3 cm | 29.3 cm | 1.0 cm |
| Men | 12 | 45 | 9 | 29.0 cm | 30.0 cm | 1.0 cm |
The largest women’s difference was 2.2 cm at US 8.5 / size 38.5, while the largest men’s difference was 1.7 cm at US 7 / size 40.
Final Thoughts
The clearest finding from this study is that shoe-size conversions are more consistent than they might seem, but not consistent enough to assume every brand follows the same system.
That distinction matters. The patterns are strong enough to make general conversion charts useful, while the exceptions are large enough to justify checking the sizing information for the shoes you’re actually buying.
More broadly, our results show why published size labels tell only part of the story. Looking at the underlying brand data reveals differences that a single conversion number can’t always capture.